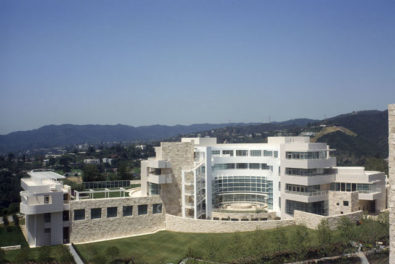
Los Angeles is a gigantic, sprawling city. Just trying to find your way across town can make you feel a little desperate. At the Getty Center, we often see visitors looking out over the landscape, attempting to get situated—“Wait, where’s downtown? Is that Santa Monica out there, near the water? What else is around here?”
We had this dilemma in mind when we built our first, modest exhibit on our brand new Ideum Multitouch table. On May 24 the Getty is hosting an event for American Association of Museums conference participants. We thought—maybe we can use the table to help visitors from across the country get a sense of the cultural landscape of L.A.?
We were really excited about the table, but even so our team struggled to find time for the project. Creating an interactive map was a big project, so initially we had to tuck project hours in around the edges of other work. We didn’t exactly know how to build for the environment, either, but we did know that we wanted to develop skill in house, so we could create bigger and more provocative things on the table later.
We ended up following a quasi-agile model for development. This meant keeping the project fairly narrow in scope and building iteratively. We set a few simple requirements up front, tried to see if we could build to them, added design refinements and real content if things were jelling, and agreed to be totally willing to jettison requirements if we what we had for a component wasn’t actually buildable.
The table, as it turns out, is quite amazing. For our first exhibit, we’re using it to provide visiting information about neighboring institutions. We’re also using the table to present some media about the Getty—user-generated images, slideshows of images of objects from our collection, and video that gives a taste of our multi-faceted organization.

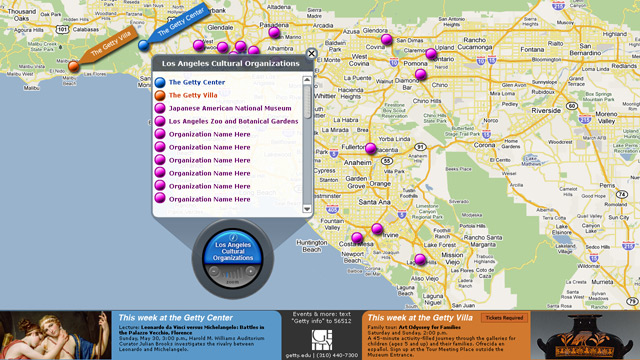
An early design for the table. The touchable, zoomable map can be navigated in two ways: by choosing a museum on the map itself, or by selecting a name from the flyout list in the controller. The footer rail offers a news feed of upcoming events at the Getty.
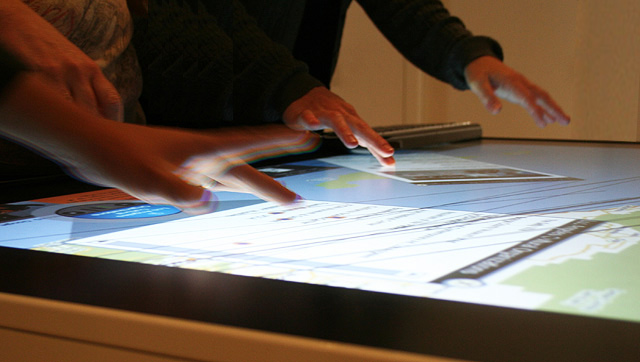
What we’ve discovered is that the table draws on people’s growing ease using gestures to engage with digital content—think iPhone and iPad. What’s more, we’re finding that the multi-user environment encourages conversation and exchange because it allows several people to “play” at the same time. People cluster in groups. If one of them doesn’t know how to engage, they watch someone else dragging and opening things by touching the surface of the screen, then try themselves and discuss what they find as they progress. The more people congregate, the more interest and conversation there is.
Next up, after May 24—figuring out how to take the table to its next level.


Hi,
Any recordings of the table in use at the conference,
or places at the Getty where people work with these now?
Thanks for your interest. We don’t have any recordings of the table in use at the conference or places at the Getty where people work with these now. A new project is likely for the fall of this year though, so check back.