
Download this paper as a PDF (14 pp., 1.5 MB).
This paper is one of three digital art history case studies edited by Murtha Baca and Anne Helmreich published as posts on The Iris and as PDFs. See also:
- Introducing Three Digital Art History Case Studies—Murtha Baca and Anne Helmreich
- Architecture and Maps, Databases and Archives: An Approach to Institutional History and the Built Environment in Nazi Germany—Paul Jaskot and Anne Kelly Knowles
- Local/Global: Mapping London’s Art Market—Pamela Fletcher and Anne Helmreich with David Israel and Seth Erickson
—Ed.

Overview
The use of technology in a digital art history project depends on the requirements of the project at the heart of the art historian’s work. But it also needs the expertise of someone familiar with database software and analytical tools who can identify benefits and potential pitfalls of specific choices and help steer the researcher to a design that is best suited to the project. The Goupil Stock Books Project, conducted at the Getty Research Institute (GRI) between 2008 and 2011, illustrates a successful collaboration between an art historian and a technologist. The project was initiated by Agnès Penot in 2007 as part of her doctoral research on the internationalization of Goupil’s network of galleries and resulted in making publicly available the Goupil & Cie/Boussod, Valadon & Cie Stock Books database.(1)
Between 1846 and 1919, Goupil & Cie was a central force in the French art market, specializing in the work of major 19th-century Salon artists such as Jean-Léon Gérôme, the principal figures of the Barbizon School, and the Dutch School.(2) Goupil also developed an international network of alliances to expand sales of prints as well as paintings that added to their success. At the height of their success in the 1880s, Goupil operated galleries in Paris, Berlin, Brussels, The Hague, and London, and had agents and clients throughout these areas as well as in New York, the Ottoman Empire, and Australia.(3)
Goupil is particularly renowned in the U.S. because many museums bought and in fact still own at least one piece of artwork with a Goupil provenance. The timing was perfect; the growth of Goupil’s galleries in the U.S. coincided with the early years of the Gilded Age, which saw a growing demand for European art and patrons building art collections for their own enjoyment as well as for public patronage. As a result, Goupil contributed to the building of some of the most famous private American collections, including those of William Tilden Blodgett, Catharine Lorillard Wolfe, William Walters, Alexander Turney Stewart, and Henry Clay Frick, and through these collectors and their bequests, to many public museum collections, including The Metropolitan Museum of Art and The Walters Art Museum.
Overview
The Getty Research Institute acquired the Goupil stock books as part of the Dieterle Collection in 1989.(4) The stock books are ledgers that record each artwork as it came into the gallery’s inventory and left as it was sold. This information formed the basis of Penot’s research, as the ledgers recorded the international circulation of works of art.
While the Getty Research Institute embarked on a project to digitize the fifteen stock books from the Parisian main office of Goupil to ensure their long-term preservation (particularly because many were in fragile condition), it was decided to combine Penot’s preliminary transcription of the first books and the images into a database. This project would make data about the more than 31,000 works of art bought and sold through Goupil searchable online. The database and web interface were designed and developed by Ruth Cuadra, Business Applications Administrator for the GRI and primary technical advisor for STAR, the database management system that supports the Getty’s Provenance Index®.
This collaborative project had several goals:
- to present these archival documents digitally while maintaining the integrity of its content and physicality;
- to expand access beyond scholars who could visit the GRI to study the stock books;
- to complement the original documents with expanded research on artists, buyers, prices, etc.; and
- to support additional uses of the data, including flexible retrieval and means by which the data could be exported by scholars for analysis and visualization.
Research Questions
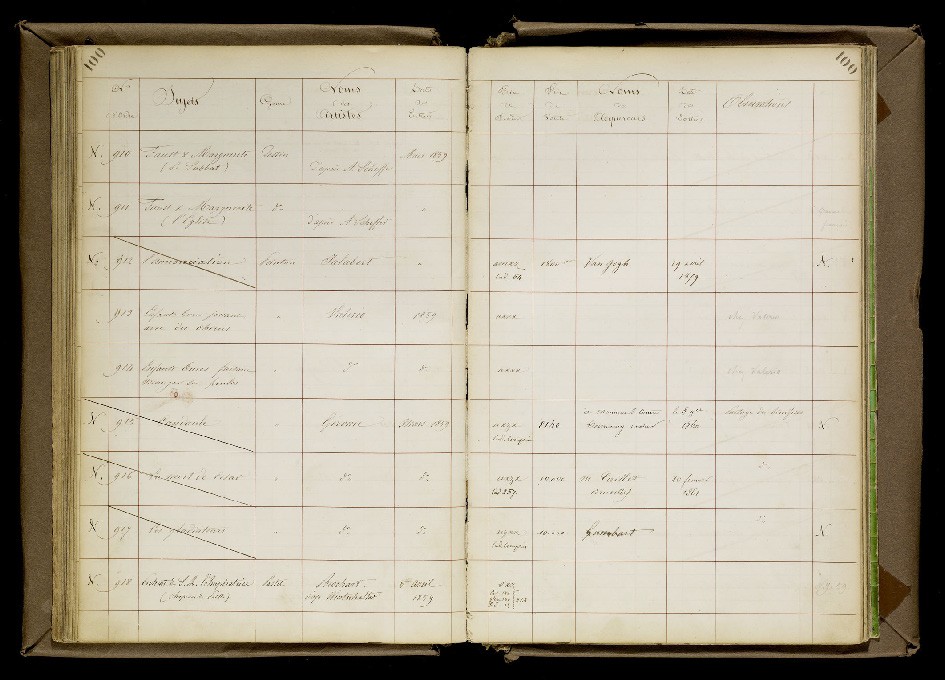
Goupil Stock Book 1, Page 100. The Getty Research Institute, 2823-978
The stock books provide a chronological list of artworks bought and sold by Goupil. Each page is divided into 12 or 13 columns, listing a unique inventory number; title/description of the work; name of the artist; object type (e.g., painting, pastel, watercolor); acquisition and sale dates; the purchase, sale and cost prices; and name of the buyer(s). In later books, details about the provenance as well as consignments, and sale and purchase locations were sometimes included. Because Goupil kept such systematic records of their transactions, these stock books have become a fundamental tool for art historians interested in the provenance of individual works of art or the works of specific artists.(5) In addition, the longevity of Goupil as a company and its large volume of transactions make these books a significant historical document on the history and mechanisms of the international art market.
Studying the relationships between the 31,277 art objects that passed through Goupil’s galleries, the people who dealt with the firm as buyers and/or sellers, and the prices at which objects were bought into the inventory and sold, required finding a way to slice the stock book information in numerous ways. Such slicing would not be possible if the only way to access the stock books was in their bound, handwritten form. It was necessary to transcribe the stock books so that information they contained could be converted to data for searching and sorting at will.
Approach and Outcomes
Initially, Penot chose to transcribe the Goupil stock books using the database software Microsoft Access, adapting the existing columns as “fields” in her database. She knew she would need to generate complex queries and statistical analyses, as well graphs and charts, all of which Access supports. She was also looking ahead to future projects involving other branches of the Goupil network. Since Access supports relational databases, which are used to organize complex data into one or more tables (or “relations”) of rows and columns linked by unique keys, she knew it would be a better choice for transcribing other stock books than Excel, for example, which supports only flat file databases. A flat file database can be thought of as a single table of rows and columns, with no relationships or links between records and fields except the table structure. The relational features of Access would allow her to perform searches and analyses across all of the databases (branch locations) simultaneously.
While Penot was working on the transcription, she and Cuadra began to develop a definition for the Goupil database in STAR that also took into account all of the fields (i.e., columns) in the stock books. The database definition included a name and data type (e.g., text, date, number) for each field and rules for how each field would be searched and displayed. At all times, Cuadra and Penot were concerned with making the data accessible in such a way that the online user would be able to search effectively and know what they were looking at when the data were displayed. This concern led them to adjust the definition repeatedly as the project progressed and the complexity of the data increased. It is important to note the act of fitting the stock book information into a fixed database definition, even though that definition could be modified, involved the interpretation of data in ways that introduced bias (see, for example, the discussion of the stock book notes under “Data Management and Interpretation”).
In the resulting database, each record corresponds to a single row on a single page in a single stock book. Once the web development work was completed, the “digital” version of a row from a stock book looked like this:
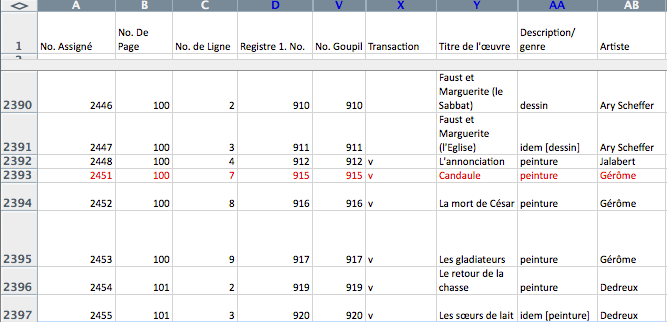
Screen shot of the database in Excel
Some data cleanups and standardizations were done in Excel, after the data was loaded into STAR, others were done with special filtering/transformation tools that are part of that system.
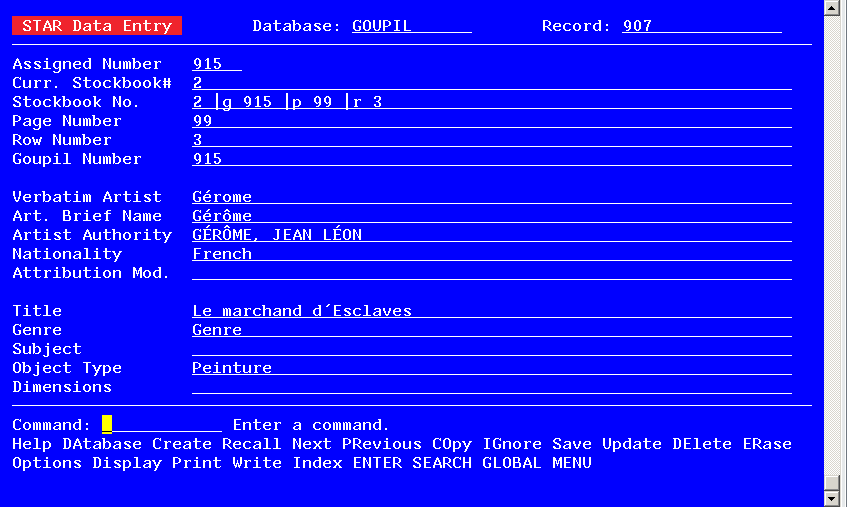
Screen shot of the database in STAR (partial record)
Data Management and Interpretation
Transcribing handwritten documents such as the Goupil stock books is very labor-intensive. Penot did all the transcription herself, using her specialized knowledge to decipher the handwriting and abbreviations and to organize the fields and data in a consistent way. The interpretation necessary to do this work caused the database to move away from being a strict digital copy of the original document. For example, some information from the “Stock Book Notes” column (e.g., previous owners’ names, purchase and sale dates, and purchase and sale locations) was split out into separate fields so each could be searched separately. In addition, some handwritten notes were excluded (e.g., details concerning traveling exhibitions, notes written in lead or colored pencil) from the database to avoid confusing the users with too many fields of notes that would be difficult to distinguish. However, all of the exhibitions and transaction details (e.g., commissions, restoration costs, framing, depreciation, etc.) and penciled notes can be viewed using the PDF copies of the stock books. A digital art history project should include a detailed compilation of how the data were managed and the editorial decisions that informed the project so that users can fully understand the completed project.
Given all of the adjustments that had to be made as the data were entered (and that some changes had to be made after data were already entered), the database was proofread in STAR by people with “fresh eyes.” Under the supervision of Christian Huemer, head of the GRI’s Project for the Study of Collection and Provenance (PSCP), Penot worked in collaboration with PSCP editors and interns to proofread, edit, and carry out data cleanups, validation, and corrections using STAR tools. Cuadra also participated in the cleanup process, performing countless batch changes that implemented corrections or changes on large and small sets of records simultaneously.
During the editing process, the editors also added value to the basic stock book information by researching artist, buyer, and seller names, including standardized authority names when possible and filling in missing information from other sources. This is another area in which interpretation, in the form of adding new information, moved the stock books further away from the original source documents.
An absolutely essential form of interpretation that was much needed to facilitate future scholarly analyses was the conversion of prices that appear in the stock books as alphabetic codes rather than numbers. To protect the sensitive nature of price information, Goupil staff encoded the dealer’s cost (Prix de revient) and the sale price (Prix de vente). For example, a work for which Goupil paid 1000 francs would be shown in the stock book as costing “AZZZ”; a work that sold for 2450 francs would show as “MNSZ.” Luckily, the meaning of the codes for the first seven books was found at the beginning of the eighth stock book: A=1; M=2; O=3; N=4; S=5; I=6; E=7; U=8; R=9 X=0; Z=0 (AMONSIEURX). But to complicate matters for translating the codes, the codes changed for the eighth through fifteenth stock book to follow this scheme: P=1; R=2; E=3; C=4; A=5; U=6; T=7; I=8; O=9; N=0; X=0; Z=0 Y=0 (PRECAUTION). Cuadra developed a process for converting these price codes, which were used for purchase and sale prices as well as dealer costs, to their numeric values.
In summary, to return to the stated goals of this project, we can say that the goal to present the stock books digitally while maintaining the integrity of the content was achieved. Although the Goupil database is not a digital carbon copy of the handwritten stock books, the interpretation of the structure and data done by the project team was needed to create a coherent and useable database. Access to the stock books has been greatly expanded by making the database available on the Web and additional information has been included that complements the original documents. And, lastly, the database can be searched in myriad ways and data can be exported for further analysis and visualizations.
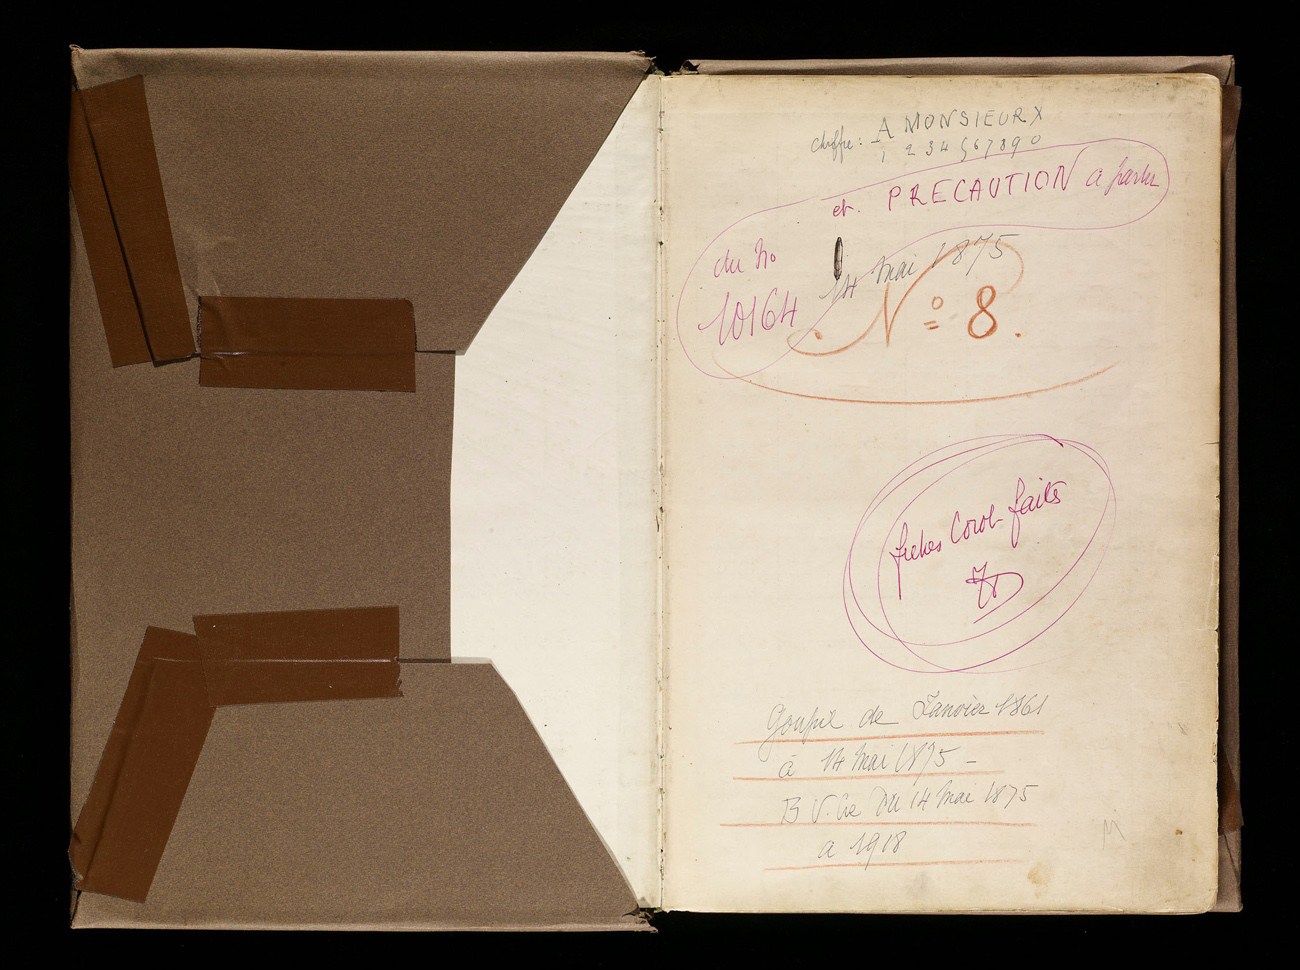
Book 8, Page 1. Conversion by Jean Dieterle of the codes used by Goupil and the change of code in May, 1875, The Goupil & Cie/Boussod, Valadon & Cie Stock Books, The Dieterle Family Records of French Art Galleries (1846–1986). The Getty Research Institute, inv. 900239
Challenges
The primary challenge for people who are thinking about a project that involves transcription like this one is to achieve a balance between preserving the integrity of the document and creating a database that favors consistency and standardization in pursuit of the most useable tool for analysis. For this project, we tried to stay as close as possible to the original document to align with the GRI’s other online databases, especially the French and the British auction sales catalogues that are part of the Provenance Index. When it was necessary to change data to make consistent searching possible, we were confident that since each database record would link to an image of the stock book page on which the transaction appears, users would have the opportunity to see the original in context for maximum clarity regarding content and meaning.
In addition to deciphering the 19th-century handwriting, the work needed to clean, validate, and standardize data from the Goupil stock books expanded as data entry proceeded through the fifteen stock books. As Goupil’s gallery business grew, changes were made in the way records were kept, resulting in new columns being added to the stock books, new and more varied data added in existing columns, and more variations in handwriting that had to be deciphered. Data cleanups and standardizations went on for months but were finally curtailed before all the work was done because of financial and scheduling constraints.
When the project was already well underway, we discovered a significant issue that had the potential to impact our entire database design and data entry workflow: When an object was not sold by the time a stock book was completed, it was carried over to the next stock book, creating duplicates in the database. For example, the database shows that Goupil purchased 1,045 paintings in 1867 but, in fact, they acquired only 649 artworks. The other 396 paintings were carried over from the previous stock book. To ensure that users could easily identify these duplicates and to be able to track the time that it took for some works to be sold (or not), we created links between duplicate entries for each object that appears in more than one book.
Successes
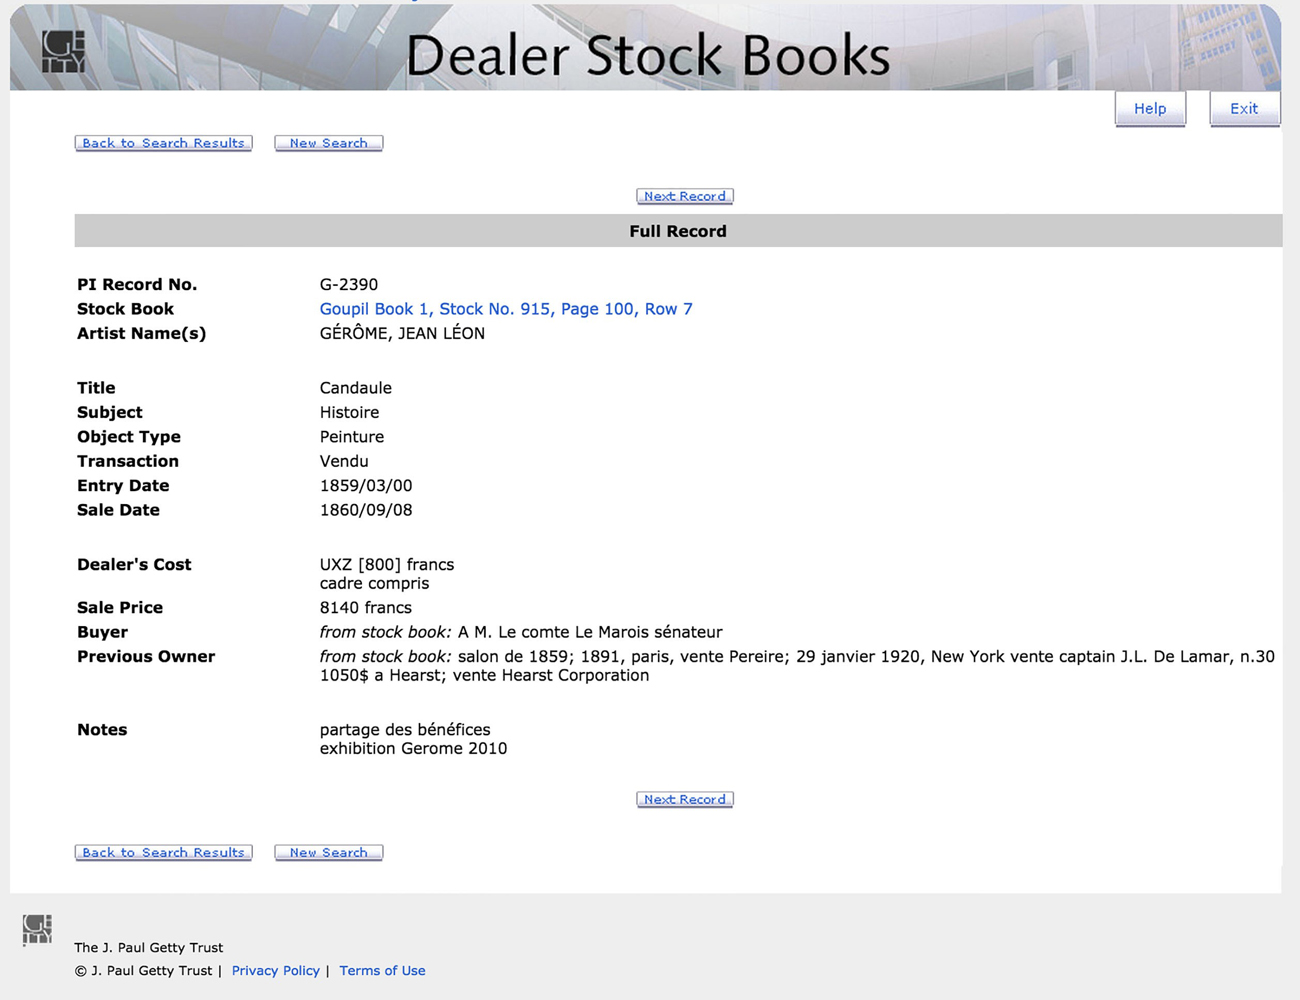
The searchability of the stock book data—every database fields is searchable—is the key feature that supports researchers looking for answers to queries concerning specific artists, art works, or buyers. Users can “slice and dice” the information in numerous ways, including by artist, title, date of acquisition, date of sale, price, name of buyer, etc. For example, a search that looks for “Gérôme” in the Artist Name field combined with “Walters” in the Buyer Name field shows that the American collector bought three paintings by Gérôme: Arnaute avec deux chiens, Diogène, and Relais de chien au desert. Finding these results would have not possible using the stock books themselves.
Adding information to enhance the basic data in the stock books, such as validated authority names for artists, has helped to ensure more complete and consistent search results. Since the stock books were photographed, we were able to create a repository of images of the individual pages in an Internet-accessible location. The unique image file names were then used to build URLs that link each database record with the image of that page. This feature is critical to providing complete access to the original source documents so that users can read and interpret for themselves how information on a particular artwork or transaction was recorded and how it was interpreted for the database.
Other changes made to the stock book data to provide for more successful searching include:
- changing the format of the entry date (date d’achat par Goupil) and sale date (date de vente/sortie) to YYYY/MM/DD, which also allows for wildcarding and consistent sorting;
- standardizing the type of object (painting, sculpture, drawing, watercolor, etc.);
- creating a “transaction” field so that works sold, not sold, exchanged, etc. can be identified. This required interpretation of marks in the stock books, e.g., a title that is crossed out meant the work was “Vendu” (sold), when no sale price is given the work was considered “Non vendu” (not sold); and
- combining notes that appear in the first and last columns of the stock books as well as in the “Observations and Notes” column are all gathered in one field titled “Stock Book Notes.”
Lessons Learned
Lessons learned by the art historian Agnès Penot
At the end of the Getty project, I had an Access database and an online database at my disposal. Choosing the tool that was suitable for my research project was tricky and required some experimentation and juggling. The online database of Goupil is a very useful tool for researchers focusing on a specific artwork, artist, or buyer but it turned out to be unsatisfactory for my project on the global history of the firm.
Cuadra exported the whole Goupil database into an Excel spreadsheet for me to work with, but given the great quantity of data, I found it was too cumbersome to work with and Excel was missing some filtering and reporting capabilities that I needed to generate in my research.
Only after I converted back to Access did I have a tool that suited my needs to perform complex queries, statistical studies, and export the reports. In one click, I was able to, for example, obtain a report showing only those objects bought by a particular client. Because Access automatically gives a unique ID number to each record in a report, the report could be modified, filtered to only show one year, or sorted in alphabetical or chronological order without affecting the rest of the database, which, as I experienced several times, is not always the case with Excel. The learning curve for Access was steep and discouraging at times, but with some reading (I recommend “Access for Dummies”!) and a lot of patience, I was able to overcome the difficulties.
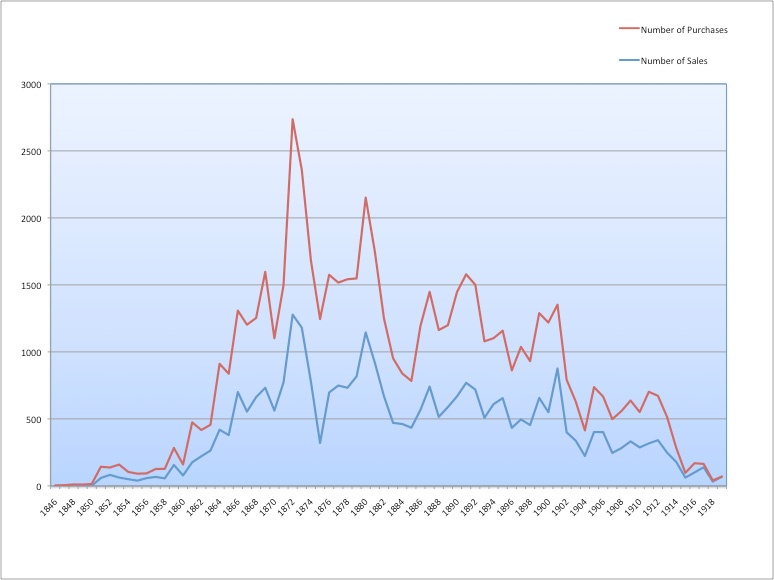
Evolution of Sales and Purchases in the Goupil database (1846–1919)
Having all my data in an Access database allowed me to create the chart above, Evolution of Sales and Purchases (1846–1919), in a matter of minutes. This graph turned out to be a key component of my dissertation as it provided a general overview of Goupil’s business cycles. At a glance, I could visualize the firm’s periods of recession, recovery, and prosperity. The effort required to learn to use Access eventually saved me time and shed light on aspects of the project that would have remained hidden or taken longer to detect and correct.
Furthermore, working in partnership with a technologist helped me to obtain a concise and more coherent set of data, which in turn allowed me to get more accurate results using statistical software. The chart above, which has been crucial for my research, could not have been done without Cuadra’s skills and assistance.
Lessons learned by the technologist Ruth Cuadra
The old saying that “looks can be deceiving” turned out to describe the technology part of this project perfectly. When I first met with Penot to discuss how we might turn her Access database into a STAR database, I saw perfectly regimented stock book pages written in a gorgeous 19th-century hand and thought it would be “easy as pie” to work with this data. After all, the keepers of those ledgers had already done the work of formatting the data and identifying the meaning of each piece, which is not always true of source materials with which I have worked. What I did not know was that we were headed down an incredibly twisty path filled changing formats, varying handwriting, encoded data, inconsistencies, and other surprises as we worked our way through books created over seven decades.
For those just starting out on a database-building project, I suggest time be spent analyzing the data with which you will be working. Look at samples of source material drawn from multiple years or concerning different kinds of objects or derived from different kinds of sources. If you are working with both print and digital sources, sample both. You want to try to find out as much about the variability of data types, formats, consistencies, and inconsistencies as you can. This knowledge will help inform both your choice of software and the design of your database.
The experience of designing the Goupil database and working with Penot and the PSCP editors to prepare the data formed the basis of the process we are now using to create a database for the Knoedler stock books. (The Knoedler Gallery was founded by Goupil, Vibert & Co in 1848 and then purchased by gallery manager Michael Knoedler. In 2012, the Getty Research Institute acquired the records of M. Knoedler & Co., including stock books covering the years 1872–1977.) The pages of Knoedler stock books are very similar to those of Goupil, so the method for transcribing the data into spreadsheets is wholly applicable. And, we are much smarter now about the need to stay flexible in our database designs in order to accommodate changing data formats and content even within a single source document.
The digitization of the Goupil stock books and the creation of a searchable database of their content have created a resource that is searched 600–800 times a month, totaling more than 25,000 searches since it went online in 2011. Both digitized primary sources and corresponding databases—available online and viewable side by side—are becoming fundamental tools for art historians.
__________
Notes
1. See: http://piprod.getty.edu/starweb/stockbooks/servlet.starweb?path=stockbooks/stockbooks.web
2. Between 1829 and 1919, the activities and functions of the firm were associated with several corporate names: Henry Rittner (1829–1831), Rittner & Goupil (1831–1840), Goupil & Vibert (1841–1846), Goupil, Vibert & Cie (1846–1850), Goupil & Cie (1850–1884), Boussod, Valadon & Cie (1884–1919), Jean Boussod, Manzi, Joyant & cie (1900–1917). For consistency, art historians tend to use the generic name “Goupil.” This name will also be used in this article.
3. See Agnès Penot, “L’internationalisation des Galeries d’Art Durant la Seconde Moitié du XIXe siècle: l’Exemple de la Maison Goupil (1846–1884),” Ph.D. dissertation, Université Paris I Panthéon-Sorbonne, 2012.
4. For information on the Dieterle Collection, see: http://primo.getty.edu/GRI:ALMA_DIGITAL:GETTY_ALMA21137926020001551
5. See, for example, John Rewald, “Theo Van Gogh as an Art Dealer,” in Studies on Post-Impressionism, London, Thames & Hudson (1986) p. 7–115; État des lieux, Musée Goupil, Bordeaux, vol. 1 (1994) and vol. 2 (1999).


Comments on this post are now closed.